Ather Energy • 2023

Ride Insights - How we turned ride insights into stories riders wanted to share

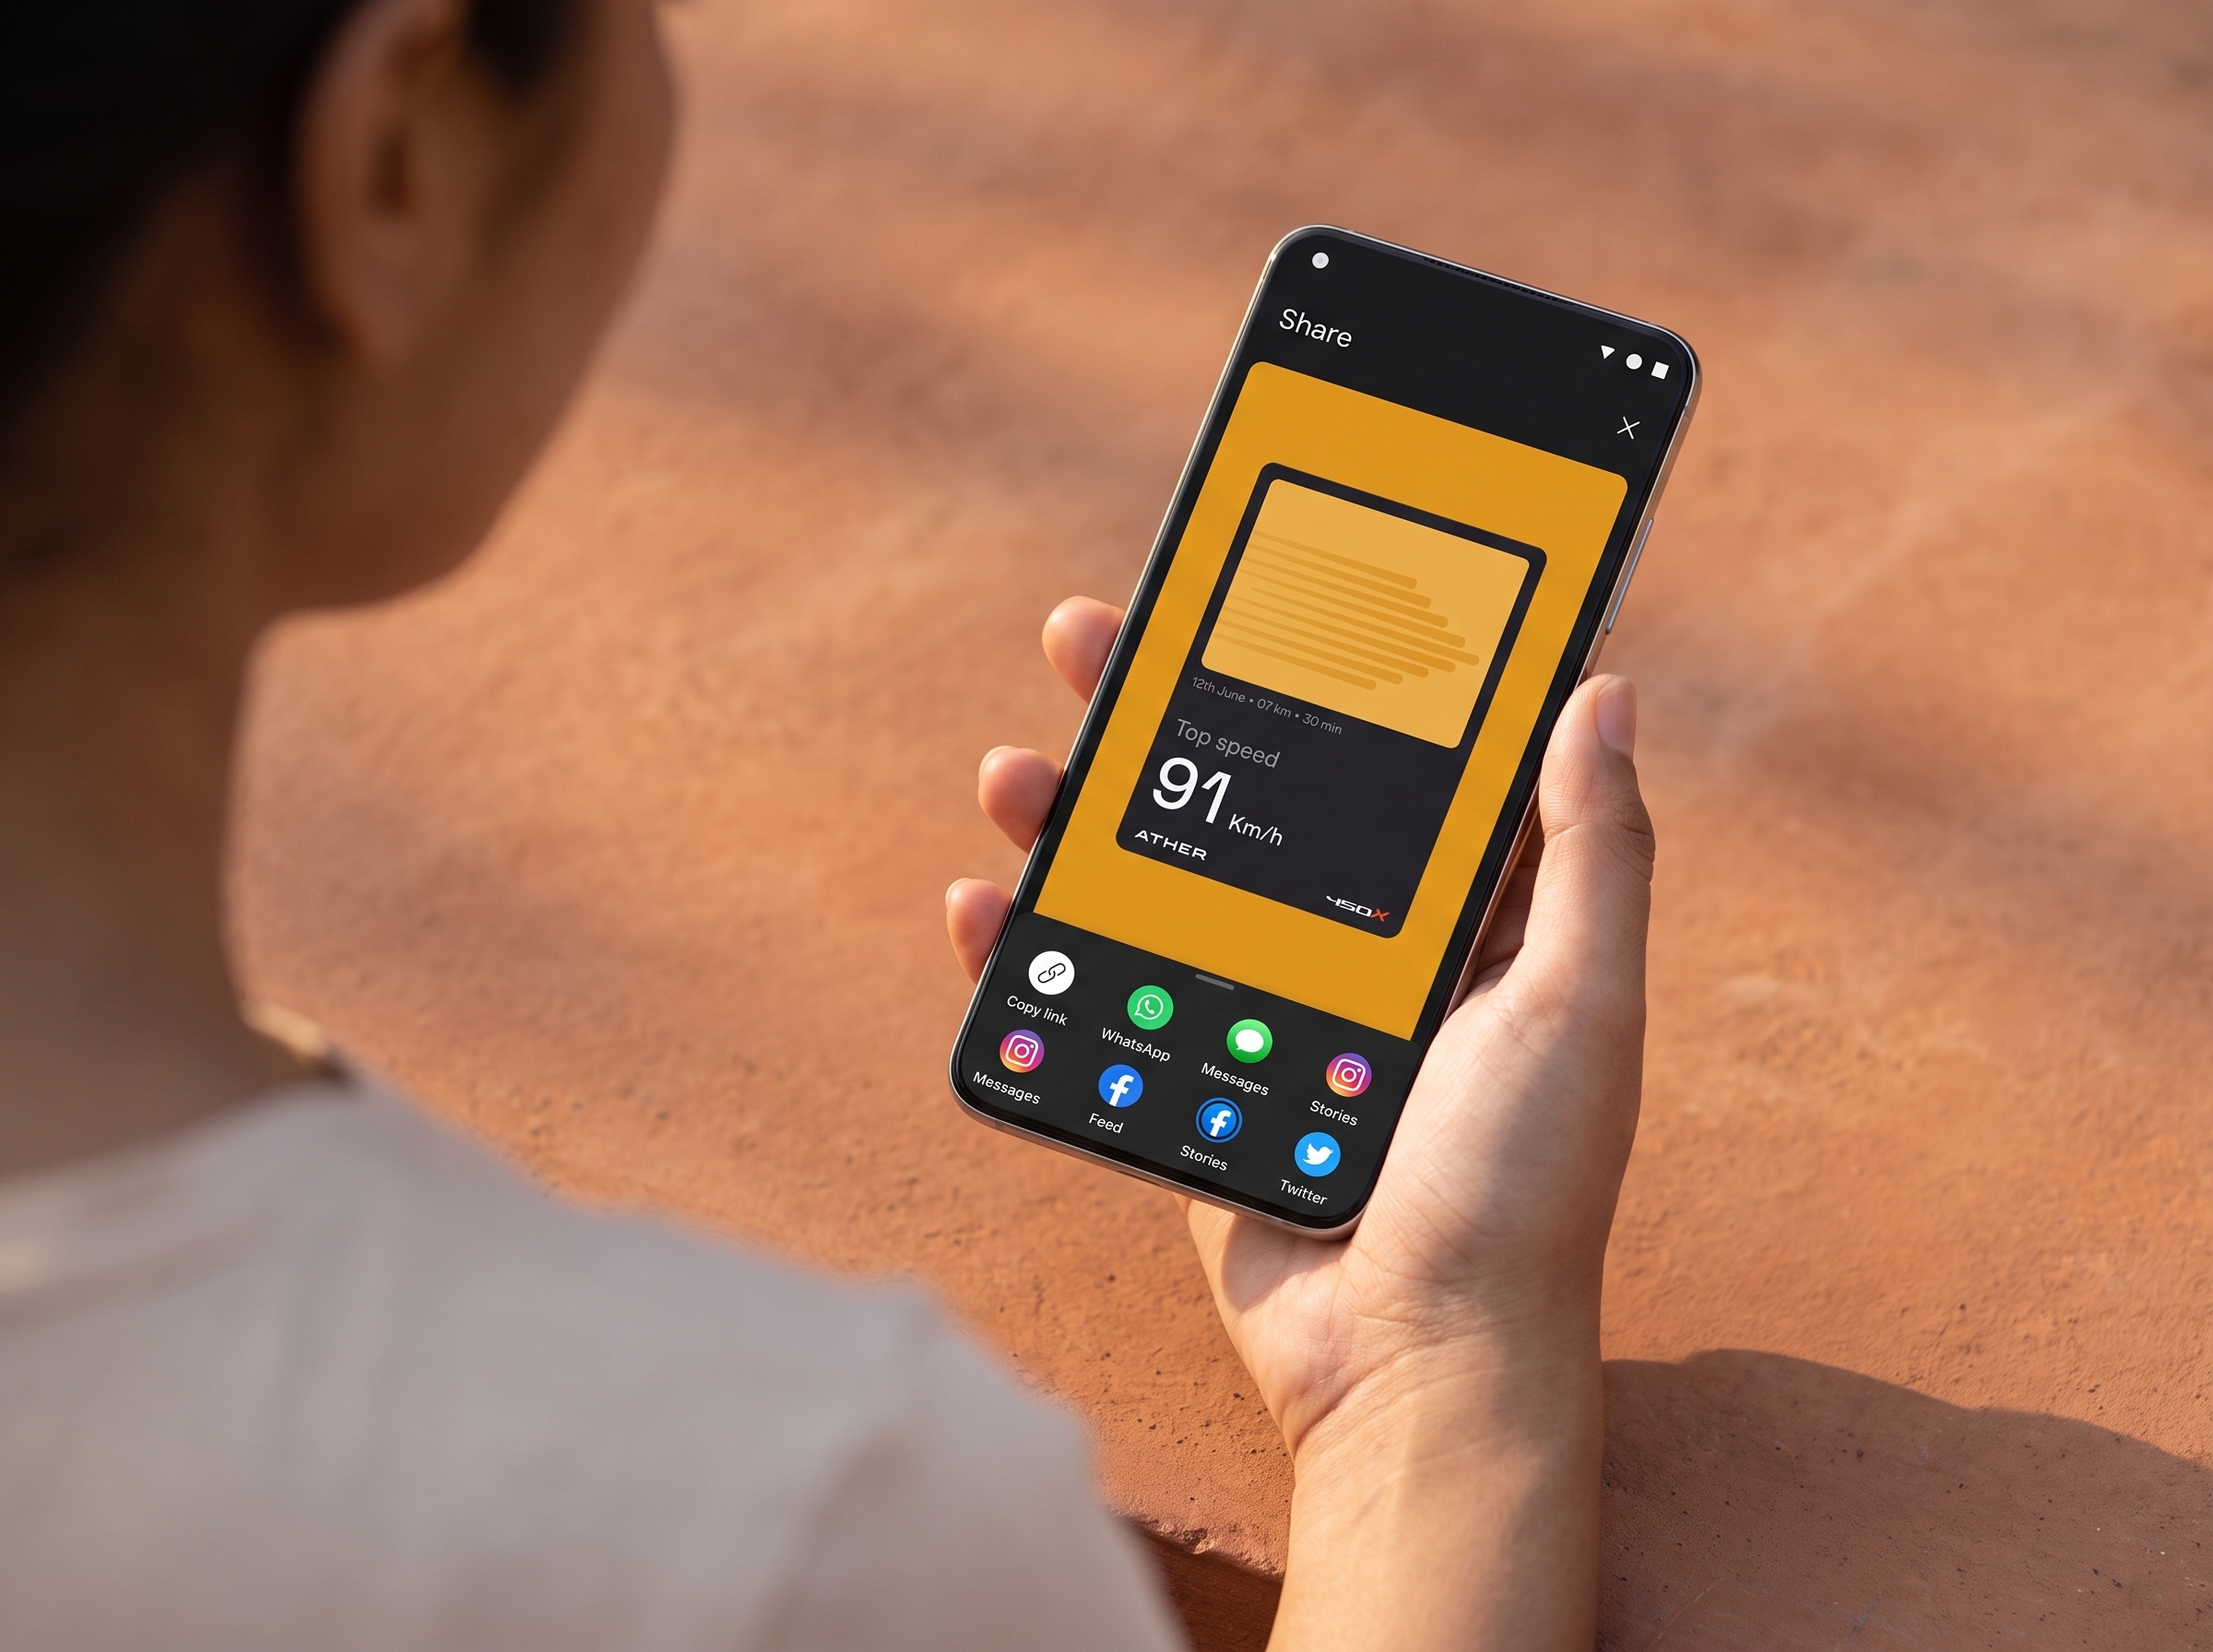
Over-the-shoulder view of a person holding a phone showing the Ride Insights share screen: top speed 91 km/h
Timeline
6–8 months
Role
Product Design, Product Management
Team
Jahnavi PatelAnupam SharmaMohini MukherjeeAbhinav Patil
Focus
Design strategy, user experience design, UI design

TL;DR

I worked on Ride Insights in the Ather app as product designer and product manager. It turns ride data into stories riders look back on and share, and engagement grew 2x.

2xgrowth in engagement
+25%higher user retention than the old app

Context

A post-ride experience riders want to share.

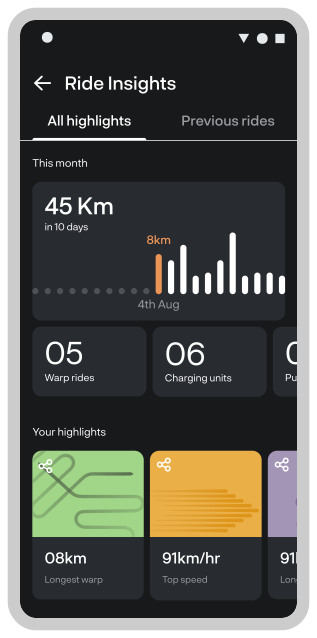
Ride Insights is a feature in the Ather app for Ather’s electric scooter riders. It uses ride data to create stories riders can look back on, celebrate milestones with, and share with other riders. We added storytelling and game elements to build a stronger emotional connection between riders and their rides, and a sense of community.

Problem

Riders wanted to show off. The old app made it hard.

01

Riders needed a visually engaging, effortless way to share their ride experiences with their community.

02

Ride data needed an intuitive, easy-to-digest format that invites riders to reflect on and celebrate their rides.

Users
Three kinds of riders

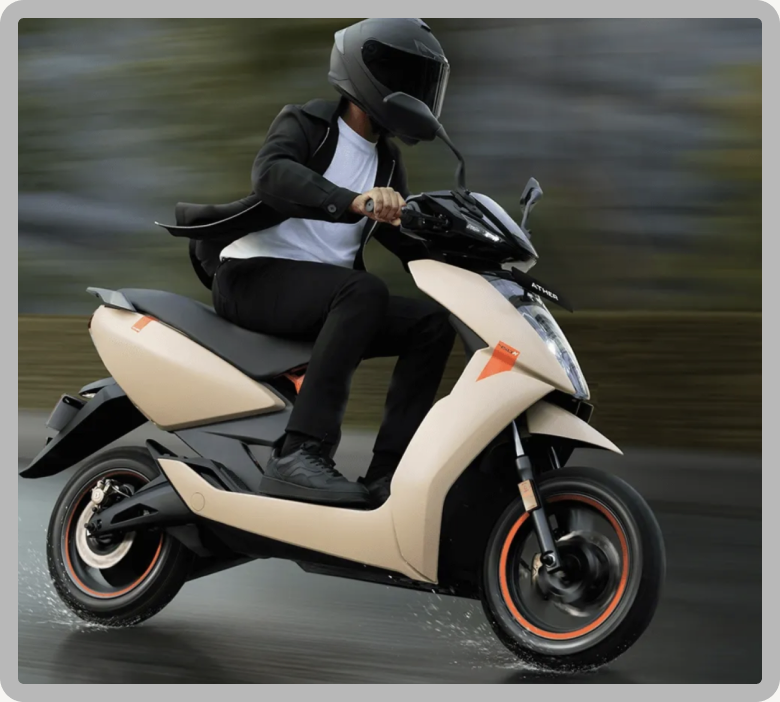
A rider in a black helmet and jacket on a cream Ather 450 scooter, speeding through a blurred green and grey background

Auto-enthusiasts

Passionate about two-wheelers, they want high performance, detailed metrics and an immersive riding experience.
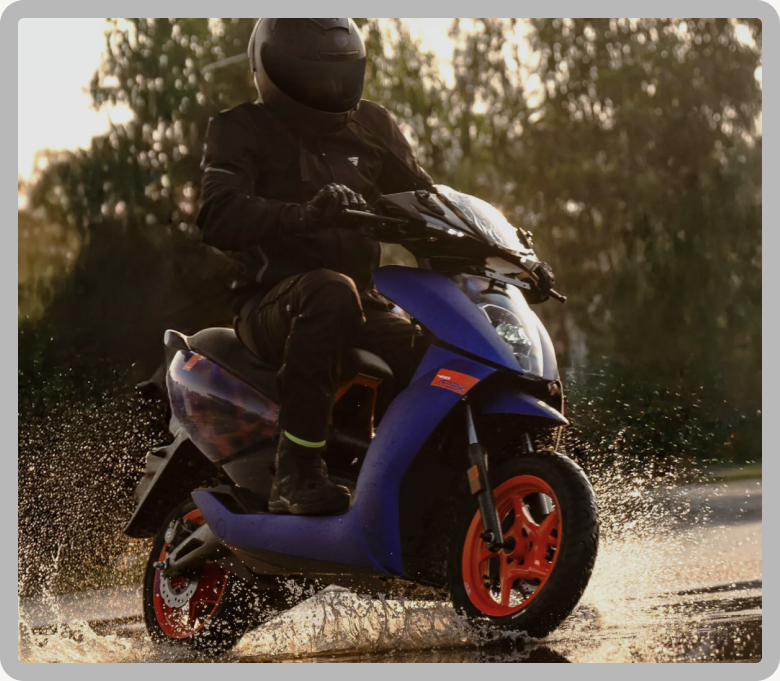
A rider in black gear on a blue Ather scooter splashing through water, with trees in warm evening light behind

The adventurers

Thrill-seekers who value durability and range. They look for new terrain and test the limits of their EV’s capabilities.
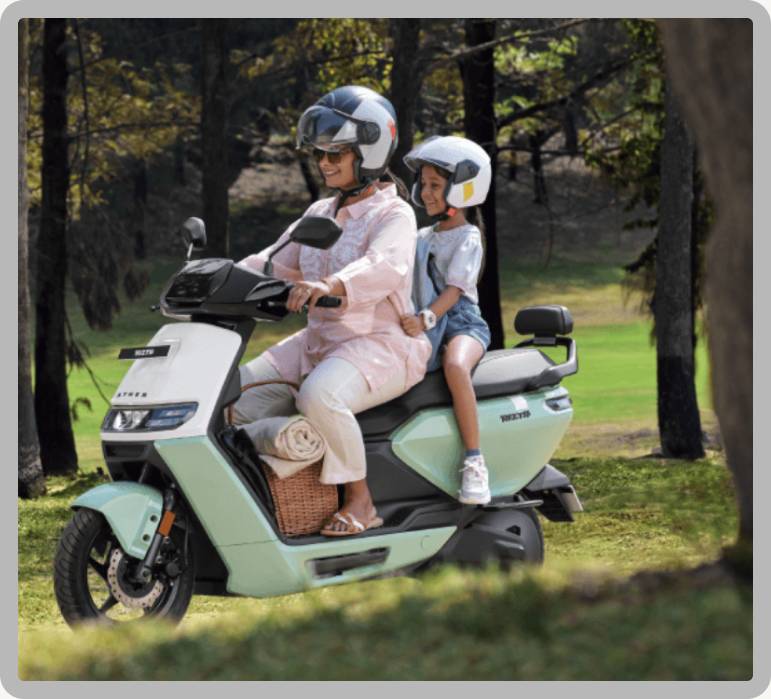
A woman and a child in helmets riding a pale green Ather scooter through a park

Efficiency seekers

Practical riders focused on getting the most from their ride in range and savings. They want to commute more cost-effectively.

Insights

Why riders check their ride data.

Our user research showed what motivates riders to look at their ride information. The goal was to make that moment more engaging and delightful.

Every ride is a performance test.

Riders switched between ride modes to benchmark themselves. They wanted proof they were getting the most out of their scooter.

A win only counts when others see it.

Sharing ride stats with fellow riders turned personal bests into validated achievements.

Riders want to connect with a rider community.

Being part of a community of owners, swapping opinions and experiences, was part of what made ownership meaningful.

Key screens

Ride data, made easy to read and share

From the home screen to a shareable card, in five moments.

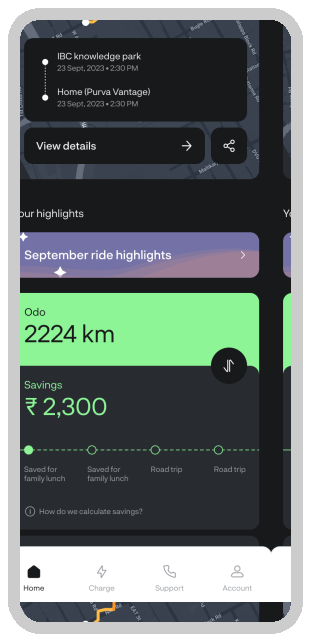
The Ather home screen: a ride card with View details and Share buttons, a September ride highlights banner, and cards for 2224 km on the odometer and ₹2,300 savedRide Insights, All highlights tab: 45 km in 10 days as a bar chart, counts of warp rides and charging units, and highlight cards for the longest warp, top speed and longest ride

Home screen & Highlights page

See total distance and savings at a glance, open your monthly highlights, and share milestone badges like top speed and peak efficiency.
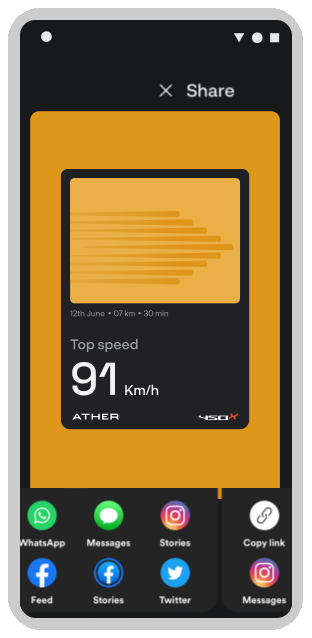
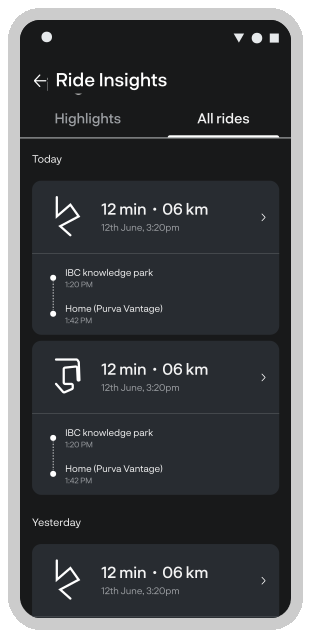
The Share screen: an orange Top speed card, 91 km/h, above sharing options for Copy link, WhatsApp, Messages, Stories, Instagram, Facebook and TwitterRide Insights, All rides tab: a list of rides grouped by Today and Yesterday, each with a time, a distance and a start and end place

Share Stories & View history in all rides page

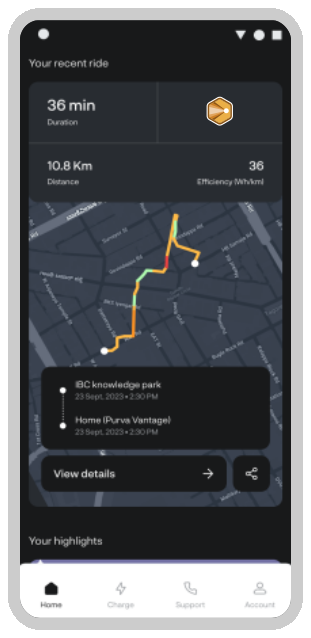
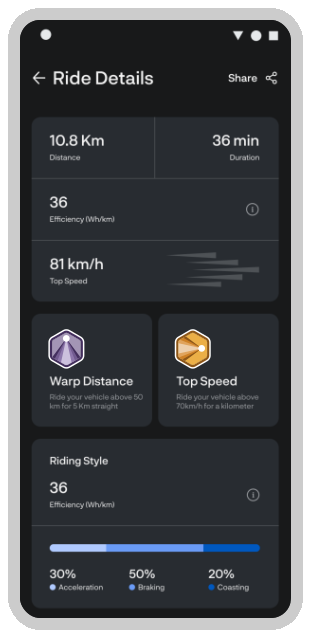
The Ather home screen after a ride: 'Your recent ride' with 36 minutes, 10.8 km and efficiency of 36 Wh/km above a map of the route, with View details and Share buttonsRide Details: 10.8 km distance, 36 minutes duration, efficiency, top speed, two badges, and a riding style bar of 30% acceleration, 50% braking and 20% coasting

Making ride details digestible

Recent rides at a glance, with essential details like efficiency, distance and duration, and a full summary for riders who want to dive deeper.
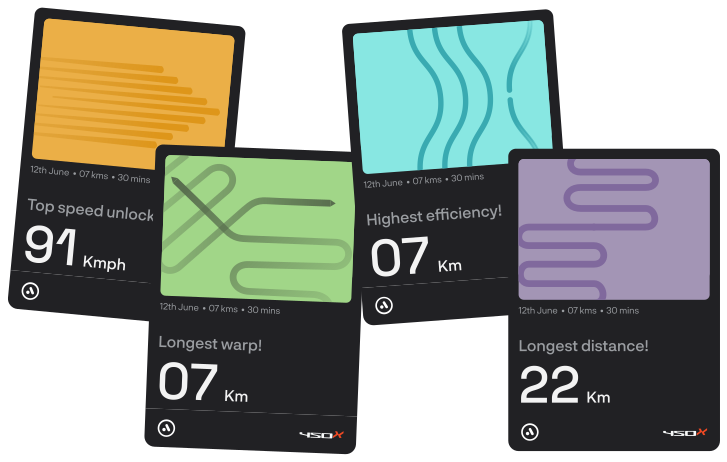
Ride highlights and milestones

Four milestone cards: Top speed unlocked, 91 Kmph; Longest warp, 07 Km; Highest efficiency, 07 Km; Longest distance, 22 Km

Milestones riders share

Cards made for sharing achievements on social media.
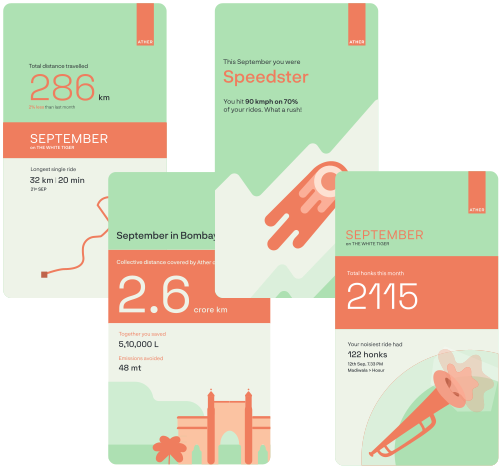
Four monthly story cards for September: 286 km total distance, a Speedster card, September in Bombay with 2.6 crore km, and 2115 total honks

Monthly highlights

Shareable stories every month, with highlights personalized to each rider’s rides.
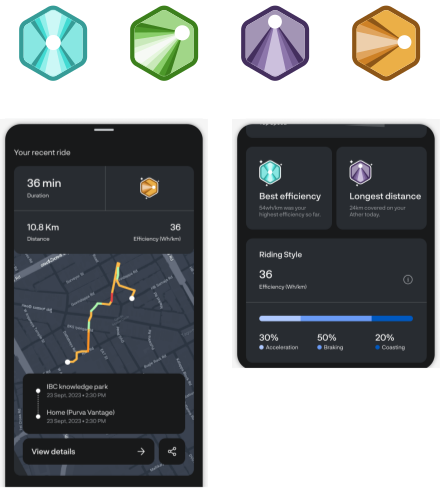
Four hexagon badges in teal, green, purple and orange above two screens: the recent ride with a route map and a badge earned, and Best efficiency and Longest distance badges with a riding style bar

Achievements

Badges are designed for ride parameters like longest distance and highest speed.

Impact
Riders engaged with their rides, and with each other.

2xgrowth in engagement
+25%higher user retention than the old app