Revivn • 2025–26

The Logistics Platform

This project is under a non-disclosure agreement. Every screen on this page has been re-rendered to remove real client names and company information, and some screens were rebuilt from scratch to show how the system works without exposing anything confidential.

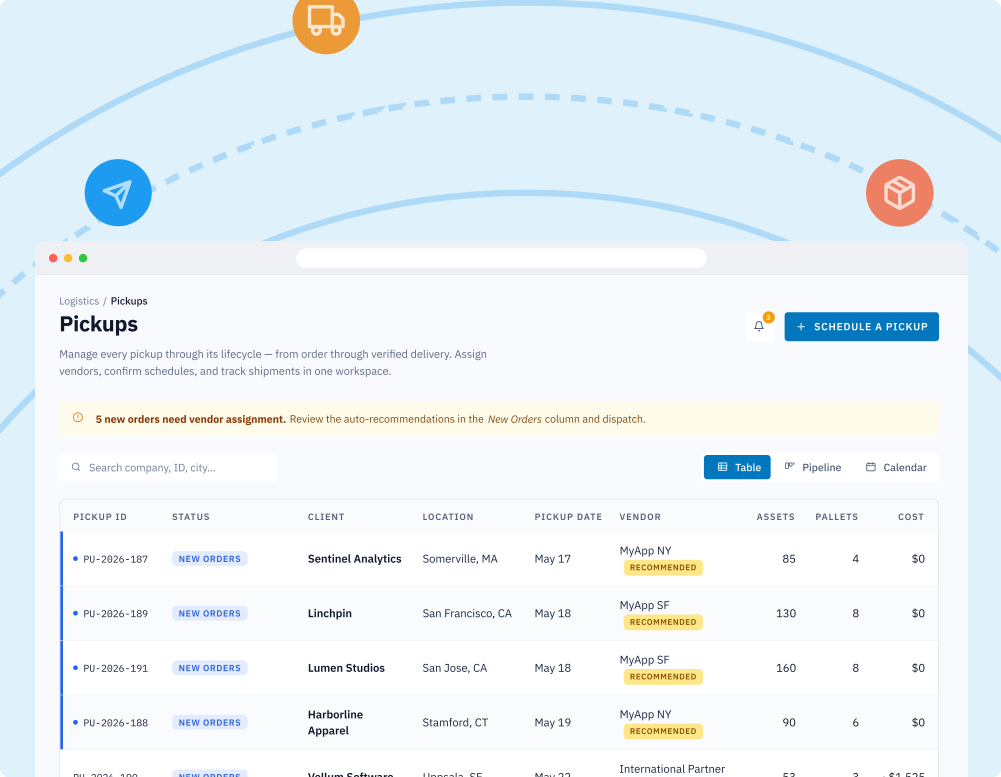
The Pickups screen of the logistics platform in a browser window, with a paper plane, a truck and a box on curved dotted routes behind it
Timeline
4 months
Role
Product Management and Product Design
Team
Jahnavi Patel - Product & DesignDanilo Gracia - Lead Engineer
Focus
Design and Strategy · Product Development

TL;DR

I led product for the new Logistics platform that replaced the five systems/tools Revivn used to coordinate pickups. We shipped a deliberately narrow first version and put it in front of Ops within weeks. Touchpoints per pickup fell from 32+ to 8. I also built the working prototype in code, using the Figma MCP and Claude Code.

−24touch points per pickup (32 → 8)
−30%scheduling time

Context

Every pickup ran across five tools that did not talk to each other.

Revivn collects and resells used IT equipment, so every pickup has to be scheduled with a vendor or internal fleets and confirmed with the client and counted on site. The logistics team did this with email, ClickUp, Slack, manual entry into an internal system, chat pings and a Typeform-built count sheet.

A walkthrough with the Ops coordinator who ran this day to day gave the baseline. The team handled 15–20 pickups a week and spent 20–30 minutes of hands-on time on each. That jumped to 10–15 pickups in a single day as we scaled. One in five client-offered pickup dates got bounced back and renegotiated.

“We’re kind of used to a super broken way of doing it.”

Ops coordinator, Revivn, in the first discovery walkthrough

Problem

Every handoff meant someone re-keying what the last person already knew.

This was not a missing feature. It was an operation held together by manual coordination, and it would not scale.

01

Nothing in the chain connected. Each of the five systems held part of the pickup, so people copied it from one to the next.

02

The paperwork broke first. Asked what fails at double the volume, the coordinator named document creation: load IDs, count sheets and insurance certificates.

Approach and solution

An integrated system that automates manual tasks when permitted to.

The biggest risk was not technical. It was building the wrong things in the wrong order, without ever testing against how Ops actually works. So I scoped V1 narrow and got it in front of Ops before building the full vision.

01

The logistics dashboard

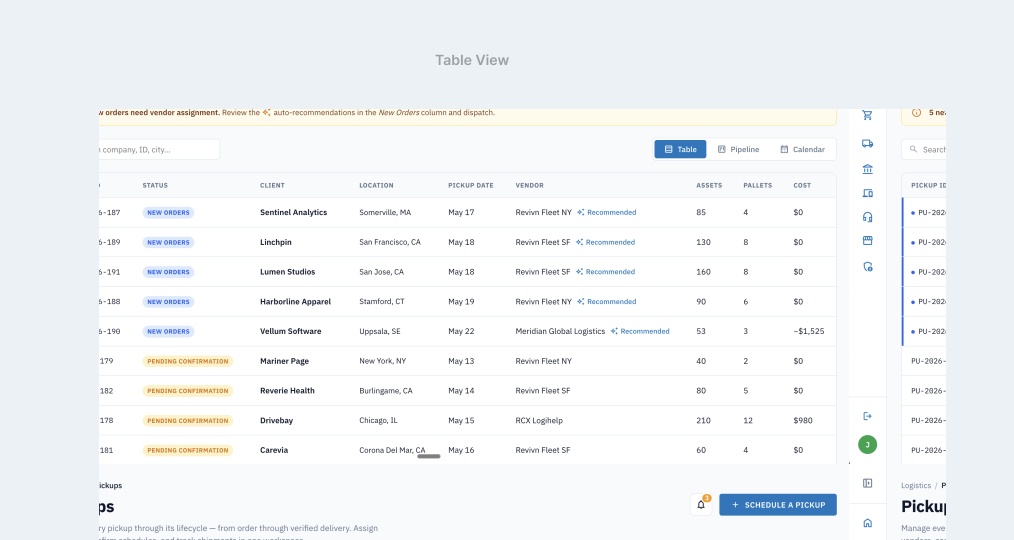
Built as a one-stop overview for everyone on the team, the dashboard has three views: table, pipeline and calendar. Each new order arrives with a recommended vendor, so the logistics team now accepts or declines in one click, where it used to take at least twice the work.

Calendar view of the logistics dashboard: the week of May 11 with confirmed pickups in their time slots, colored by status
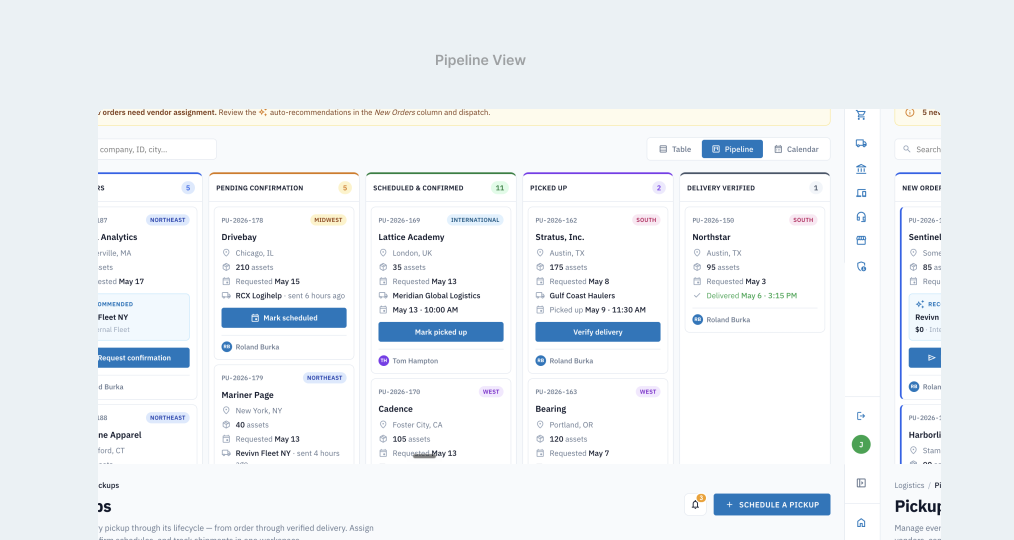
Pipeline view of the logistics dashboard: pickups as cards in five columns, from New Orders to Delivery Verified, each new order showing a recommended vendor
Table view of the logistics dashboard: a list of pickups with status, client, location, date, vendor, assets, pallets and cost, and a recommended vendor on new orders

02

Vendor management

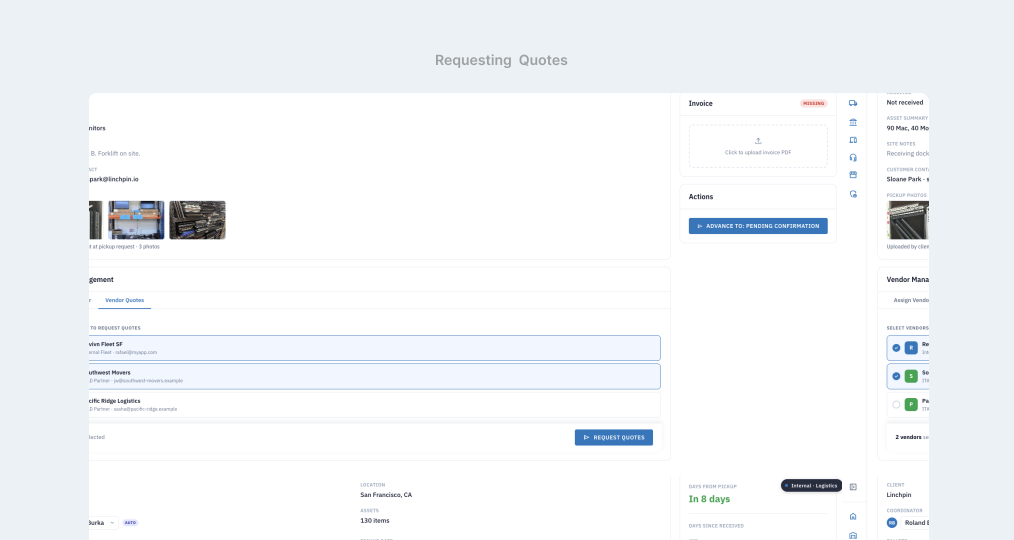
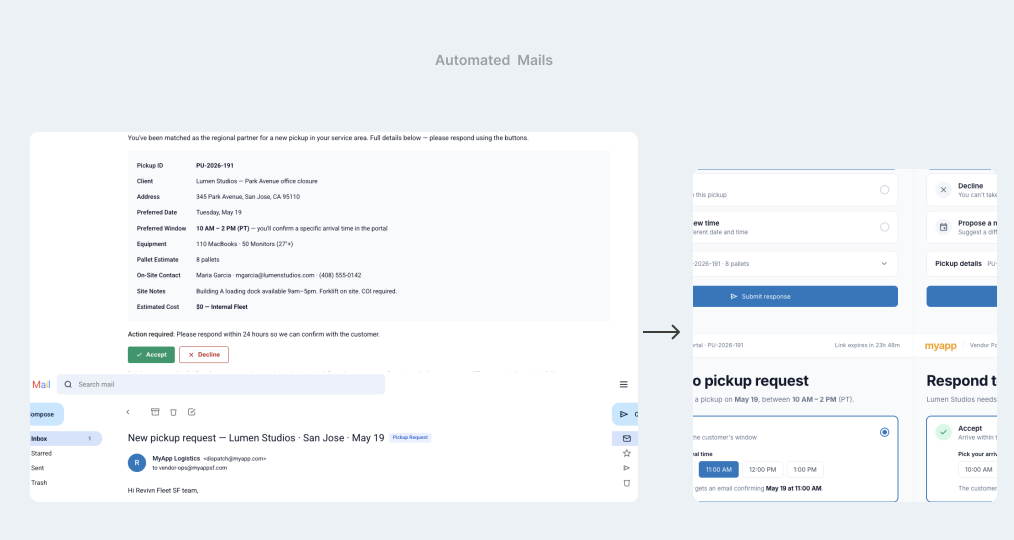
The workflow behind vendor management: it identifies the best vendor for each pickup, emails them the pickup details, requests quotes, awards the job and automates the repetitive communications. The system updates itself from each vendor's response.

Vendor Quotes tab of a pickup: two of three vendors selected to request quotes, with a Request Quotes button
The vendor request email with Accept and Decline buttons, and an arrow to the vendor portal page it opens
A scheduled pickup on the internal platform: confirmed time, confirmed vendor with contacts, and a timeline of vendor accepted and customer confirmed

03

Intake form and Countsheet

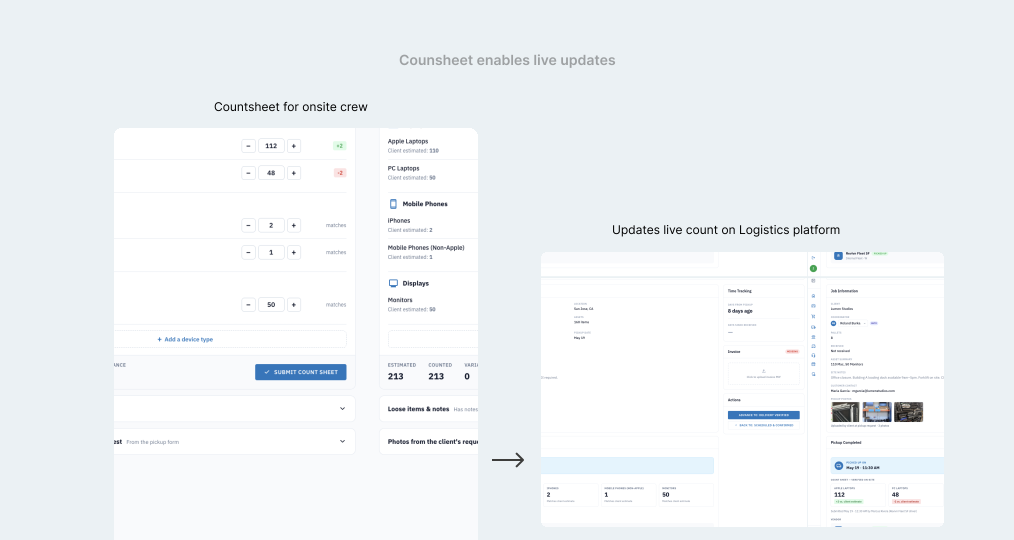
The intake form now asks clients about the pickup site up front, so the team arrives knowing what to expect. On site, the count sheet comes pre-filled with the devices the client committed to. Associates add or edit counts to match what is actually there, and the moment they submit, the internal platform updates. This resulted in increased visibility and transparency for the logistics team.

The count sheet on a phone, pre-filled with the client's estimates, and an arrow to the pickup detail on the logistics platform, which shows the counted numbers
The updated pickup request form: a new Site Information section with building, dock and truck details, and a new What's in your pickup section with counts by device type

Building with Figma + Claude Code

From Design to Code, with AI

Building this prototype was an incredibly enriching experience in exploring AI-powered development as a design team of one. I designed the screens in Figma, connected our existing design system through Figma MCP, and used Claude Code to translate those designs into a functional React prototype running locally in the browser. It was a valuable opportunity to bridge design and development, experiment with AI coding tools, and take an idea from Figma to a working product.

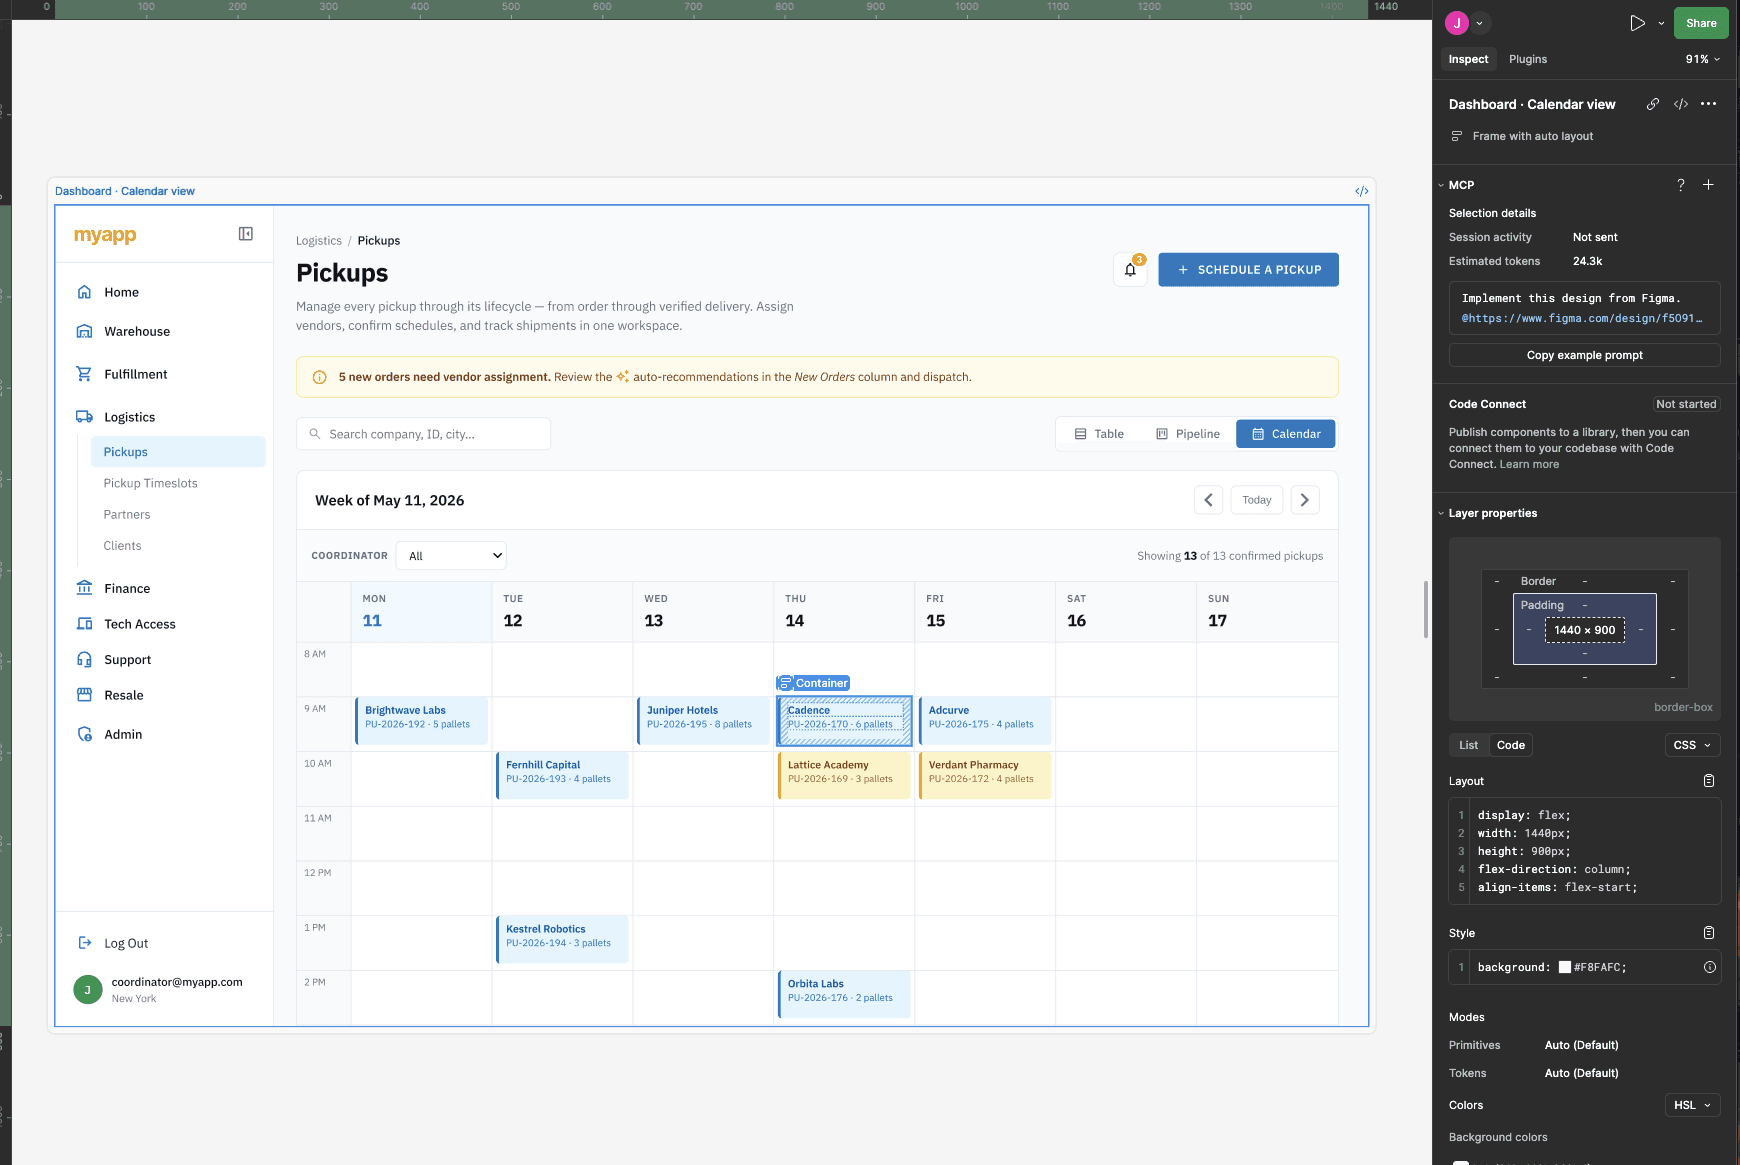
The calendar view of the logistics dashboard open in Figma, with the Figma MCP panel showing the prompt 'Implement this design from Figma'

The design in Figma, with the Figma MCP prompt that hands it to Claude Code.

The prototype running on localhost.

Results

V1 connected the whole pickup, from request to verified delivery.

A client submits a pickup request. Ops selects a vendor. The vendor gets a magic link to accept or counter-propose, and the client confirms. The order then moves through five states on its own: New Order, Vendor Selected, Scheduled, Picked Up and Delivery Verified.

−24touch points per pickup (32 → 8)
−30%scheduling time